

The One Number That Determines When Work Becomes Optional
It's not your salary. It's not your returns. It's the gap between what you earn and what you keep.

Every week we sit across from households earning $250,000 or more who feel stretched. Not because they don’t earn enough. Because expenses have quietly grown to match income - and the savings rate was never intentionally set.
It was whatever was left over. Or it was a number that felt right years ago and never got revisited. $5k a year when you’re 23 seems incredible. At 45 its a different story. Meanwhile income grew, lifestyle followed, and the gap between earning and keeping slowly closed.
This is one of the most common - and costly - patterns we see at this income level. And it’s fixable. But only once you see it clearly.
This week, we’re breaking down why savings rate may be the single most important variable in your financial plan - and what the math looks like when two identical households make one different choice.
Let’s dig in
The Variable Most High Earners Ignore
High earners tend to be optimizers. They negotiate compensation packages, select funds carefully, rebalance portfolios, and stress about tax efficiency. All of that matters.
But savings rate - the percentage of income you actually keep and invest - may be the most direct variable determining when work becomes optional. More than your return rate. More than your fund selection. More than almost anything else you spend time on.
And yet for most households we work with, it was never intentionally decided. It was a default.
Two Households. Same Everything. One Different Choice.
Here’s a comparison we walk clients through regularly.
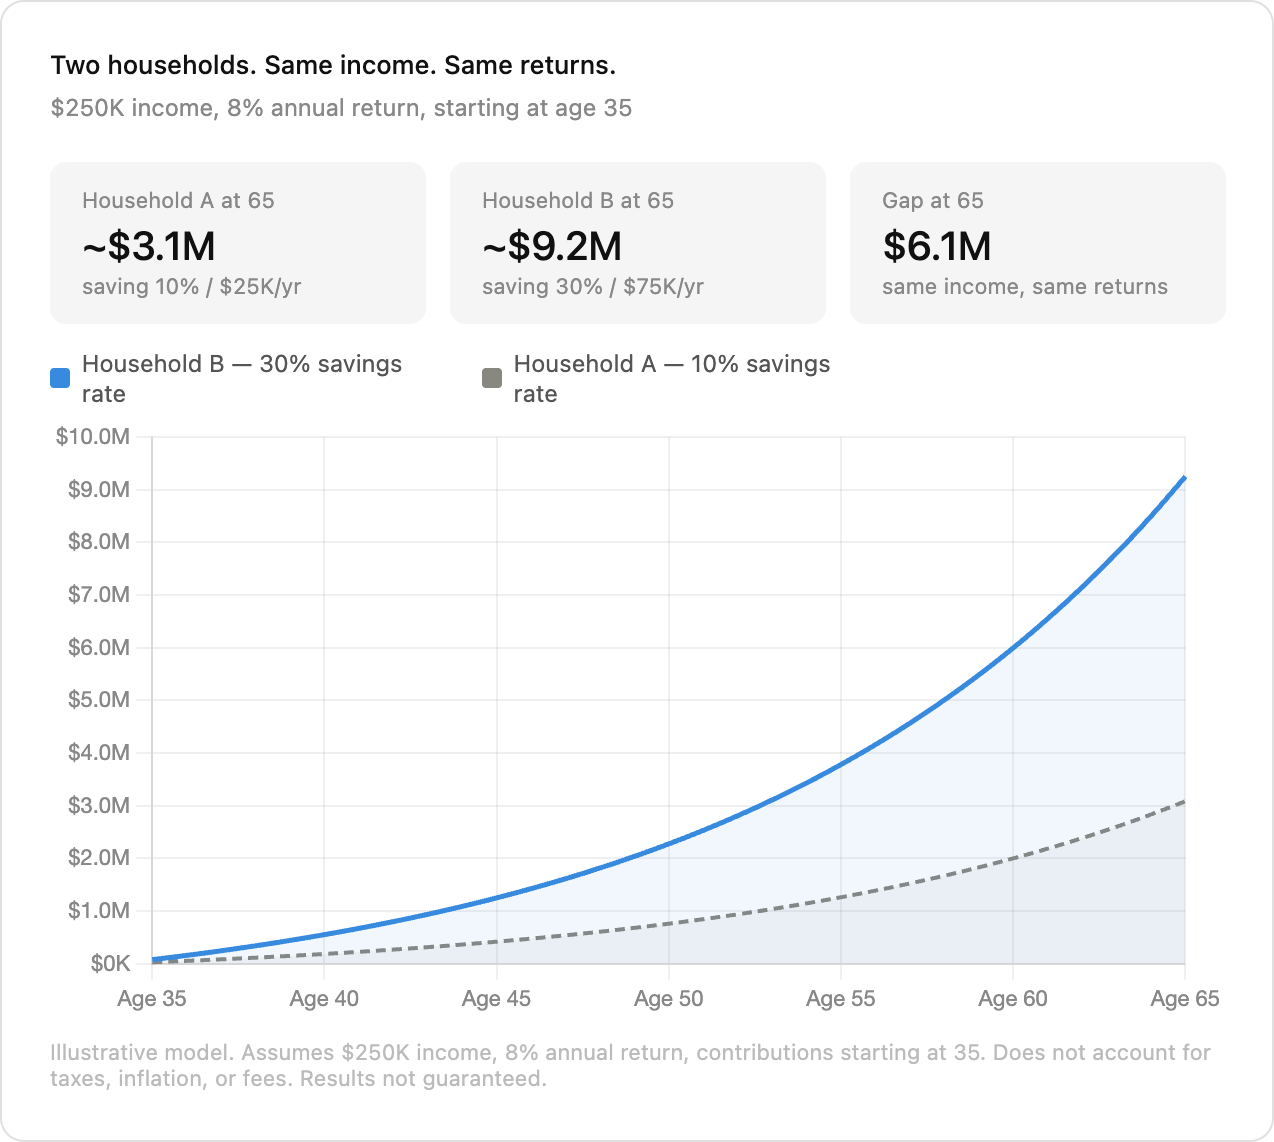
Two households. Both earning $250,000. Both starting at age 35. Both investing at an assumed 8% annual return.
Household A saves 10% - $25,000 per year invested. Household B saves 30% - $75,000 per year invested.
Here’s where each household lands:
Age 45:
Household A: ~$391,000
Household B: ~$1,173,000
Age 55:
Household A: ~$1,236,000
Household B: ~$3,707,000
Age 65:
Household A: ~$3,059,000
Household B: ~$9,176,000
Gap at 65: $6,117,000.
Same income. Same returns. Same starting age. One different number.
The Part Most People Miss: It Lowers the Finish Line Too
Here’s where the math gets genuinely interesting - and where most conversations about savings rate stop short.
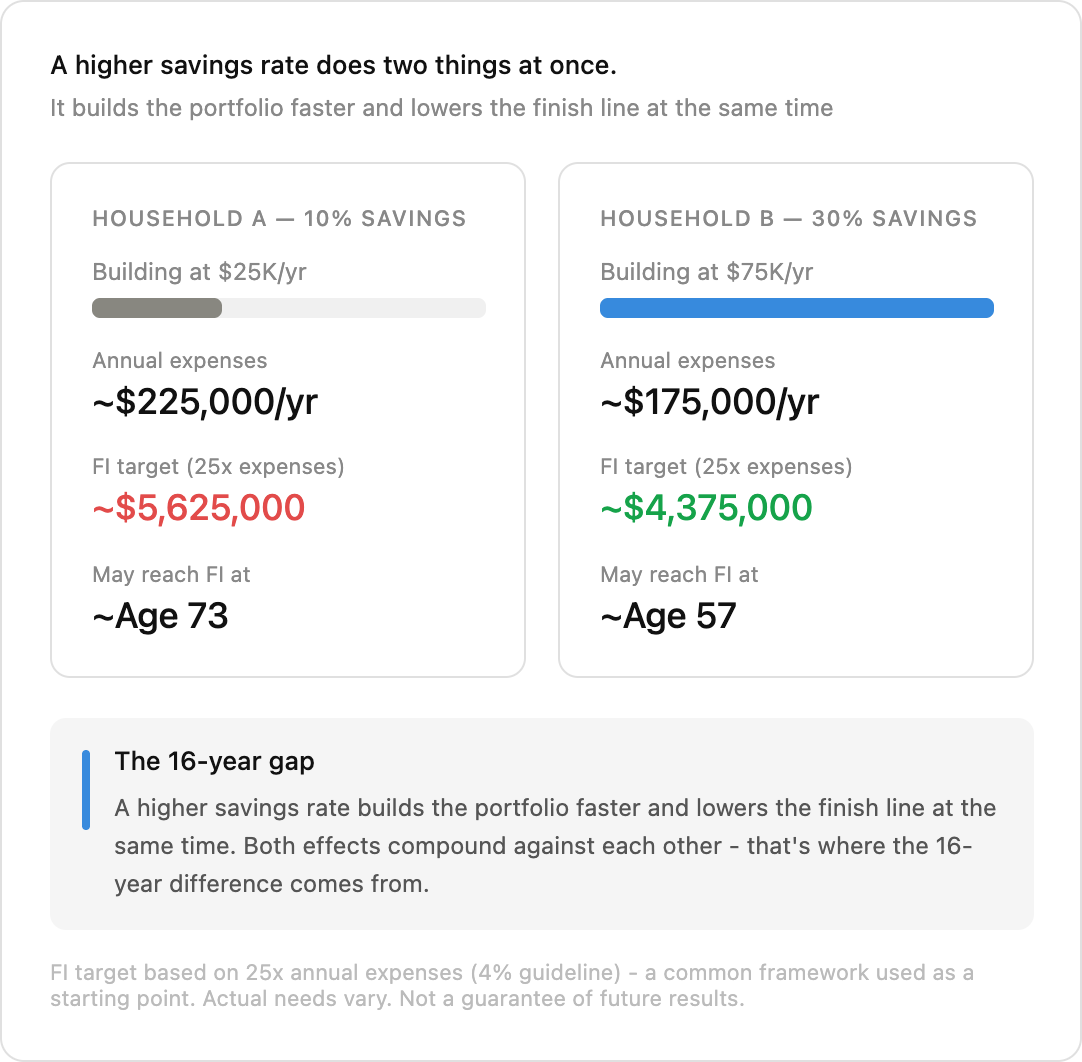
A higher savings rate doesn’t just build the portfolio faster. It also lowers the amount you need to retire. Because if you’re living on less, you need less to sustain that life indefinitely.
Using a common framework many financial planners reference as a starting point - 25x annual expenses, based on the 4% guideline - the two households don’t just have different portfolios. They have different finish lines.
Household A is spending roughly $225,000 per year. To sustain that, they may need approximately $5,625,000.
Household B is spending roughly $175,000 per year. To sustain that, they may need approximately $4,375,000.
The higher savings rate is working on both ends simultaneously - building the portfolio faster while reducing the target at the same time. That dual effect is where the real gap comes from.
Running each household to their number: Household A may reach financial independence around age 73. Household B may reach it around age 57.
Sixteen years. Identical incomes. Identical markets.
A few important caveats: this simplified model doesn’t account for Social Security, pension income, taxes, inflation, or investment fees - all of which would affect the actual outcome. Investment returns are not guaranteed. But the directional point holds: savings rate is doing far more work than most people realize.
What the Portfolio Actually Buys You Before Retirement
This isn’t only a retirement story. And that’s the part that tends to land hardest in our conversations.
At age 50, Household B has approximately $2,200,000 invested. Household A has approximately $733,000.
That difference isn’t just a number on a statement. It’s what determines your options - long before you ever think about retiring.
Here’s what $2.2M at 50 may make possible:
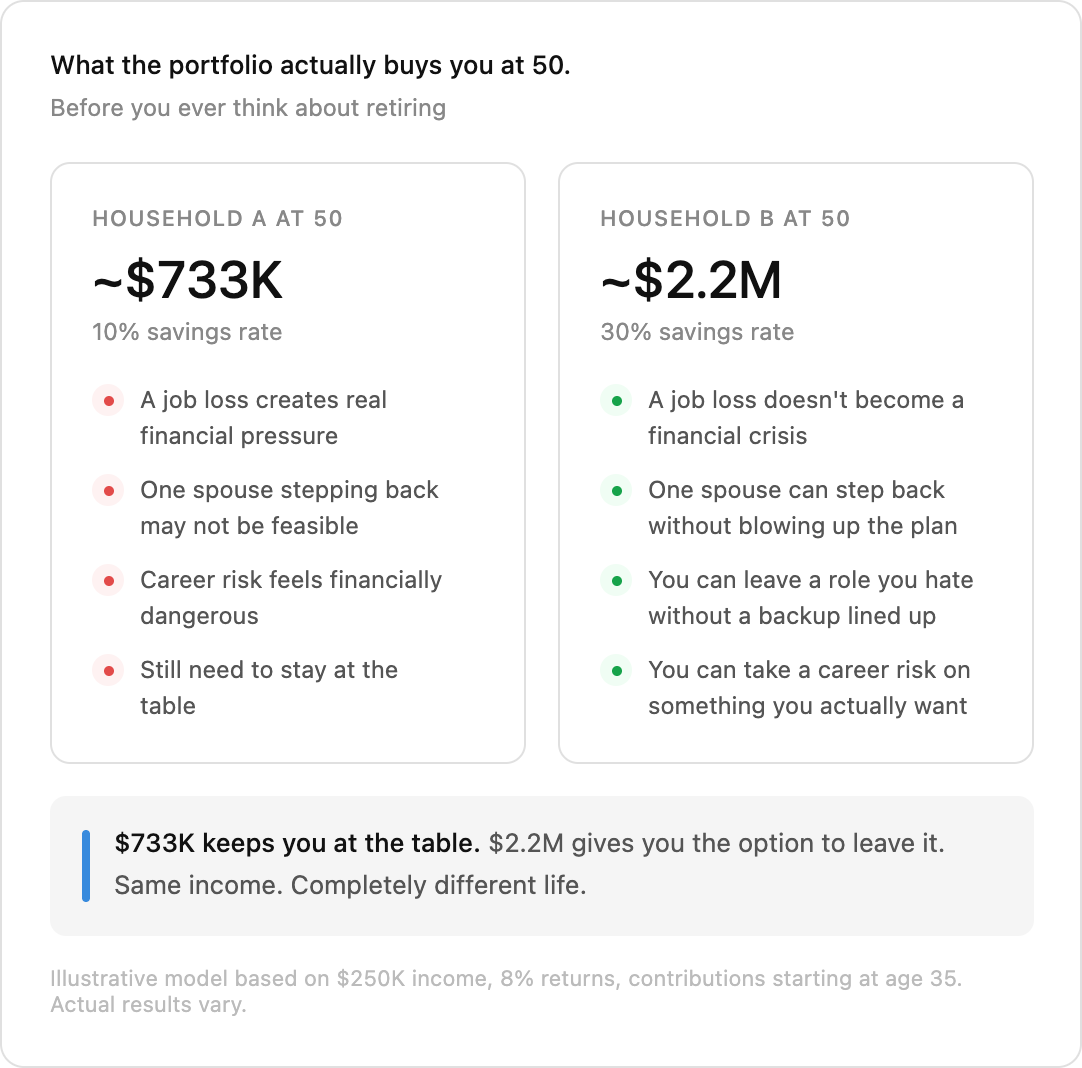
That’s not a retirement metric. That’s an optionality metric. And it shows up - or doesn’t - well before age 65.
How a $250K Household Ends Up Saving 10% (Or Less)
It doesn’t happen because of bad decisions. It happens because of a pattern that’s almost invisible while it’s occurring.
Income grows. Lifestyle follows. A bigger house. Nicer cars. Private school. More travel. A second home or a renovation that made sense at the time. Each upgrade feels earned - because it is. At $250,000 a year, these things are genuinely within reach.
But each one raises the monthly floor. Each one raises the FI target. And each one pushes the finish line a little further out.
The savings rate quietly erodes - not through recklessness, but through a long series of completely reasonable choices that nobody added up.
This is lifestyle creep. And it’s one of the most costly financial patterns that exists at high income levels, precisely because it never looks like a mistake in the moment.
How to Think About Your Own Savings Rate
The households building real optionality at this income aren’t always earning more. They’re keeping more - intentionally, before lifestyle has a chance to absorb it.
A few questions worth sitting with:
What is your actual savings rate today - not what it was when you set it up, but what it is right now? Do you know the number?
Has your lifestyle grown proportionally with your income? If income has gone up 40% in five years and savings has grown by 10%, the gap is widening even if the dollar amount saved looks larger.
Do you know what your FI number is? Without a target, savings rate becomes arbitrary. With one, it becomes a dial you can actually turn.
There’s no universal right answer for what the savings rate should be. What matters is that it’s intentional - set in advance, not whatever’s left over after everything else.
Bottom Line
Savings rate may be the single most important variable in projecting the long-term success of a financial plan. Not because the other variables don’t matter. Because this one does two things at once.
Household A (10% savings): may reach financial independence around age 73, needs ~$5.6M, has ~$3.1M at 65
Household B (30% savings): may reach financial independence around age 57, needs ~$4.4M, has ~$9.2M at 65
The 16-year gap comes from one variable - savings rate - working on both the portfolio and the finish line simultaneously
At age 50, the difference between the two households isn’t just $1.5M - it’s the difference between options and obligation
Lifestyle creep is the mechanism. Intentional savings rate is the defense.
The goal isn’t to deprive yourself. It’s to make the choice consciously - before lifestyle makes it for you.
Because $250,000 a year is a remarkable income. Spending most of it isn’t a failure. But it may quietly delay financial freedom by 16 years.
Dial in the savings rate. Everything else is noise.
See you next week.

Whenever you’re ready, there are 2 other ways we can help you:
Join The Opulus Method Newsletter — Every Tuesday, I share strategies that help high-income millennials build wealth without sacrificing their life. Join 2,500+ readers.
Work With Us 1-on-1 — We’ll build your personalized strategy to cut your taxes, maximize your income, and grow your wealth month after month. You focus on living your life. We handle the financial strategy and execution.
Opulus, LLC (“Opulus”) is a registered investment advisor in Pennsylvania and other jurisdictions where exempted. Registration as an investment advisor does not imply any specific level of skill or training.
The content of this newsletter is for informational purposes only and does not constitute financial, tax, legal, or accounting advice. It is not an offer or solicitation to buy or sell any securities or investments, nor does it endorse any specific company, security, or investment strategy. Readers should not rely on this content as the sole basis for any investment or financial decisions.
Past performance is not indicative of future results. Investing involves risks, including the potential loss of principal. There is no guarantee that any investment strategies discussed will result in profits or avoid losses.
All information is provided “as-is” without any warranties, express or implied. Opulus does not warrant the accuracy, completeness, or reliability of the information presented. Opinions expressed are those of the authors, Ryan Greiser and Francis Walsh, and are subject to change without notice.
Opulus is not responsible for any errors or omissions, nor for any direct, indirect, or consequential damages resulting from the use or reliance on this information. Use of the content is at your own risk. This content is not intended as an offer or solicitation in any jurisdiction where such an offer or solicitation would be illegal.