


Last Wednesday morning, my buddies were blowing up the group chat.
“Wow, market is ripping. Let’s go!”
Thursday morning. Same group chat.
“PAIN.”
Twenty-four hours. Two days after the election. Zero changes to anyone’s actual financial plan.
If you felt the whiplash last week, you weren’t alone. The Dow had its best post-midterm day since 1982 on Wednesday, jumping more than 1,500 points. Then on Thursday the S&P 500 fell more than 3% and the Nasdaq dropped around 5%, wiping out the entire rally and then some.
Cable news had a field day. I’m guessing some of your group chats looked similar to mine (if you talk finance with your friends.)
Here’s what nobody ever says: the long-term data on elections and markets is about as boring as data gets. And boring is great news for your portfolio.
Let’s dig in ↓
What Actually Happened Last Week
Quick recap. Democrats won control of both the House and the Senate, setting up a divided government starting in January. Markets initially liked the certainty. Stocks rallied, oil fell, bond yields dropped.
Then Thursday hit.
The selloff was led by AI and semiconductor stocks. Chip stocks fell roughly 11% in a single session. Nvidia alone dropped more than 8%. Some investors worried a new Congress could mean tighter rules on data centers, but chip stocks were already sliding on AI-spending fears before the elections even happened.
So was it the election? Partly. But also, it was a crowded trade unwinding.
That distinction matters. If you react to the wrong cause, you make the wrong move.
The Stat That’s Gone 19 for 19
Midterm years are historically the roughest stretch of the four-year presidential cycle. Since 1950, the average peak-to-trough drop during a midterm year is about 17.5%. Uncertainty is high, campaigns are loud, and markets hate not knowing.
But look at what happens after.
Since 1950, the S&P 500 has been higher 12 months after every single midterm election. 19 for 19. The average gain: roughly 15%.
Compare that to the average for all 12-month periods over the same stretch: about 9%.
Red wave. Blue wave. Split Congress. Unified government. Didn’t matter.
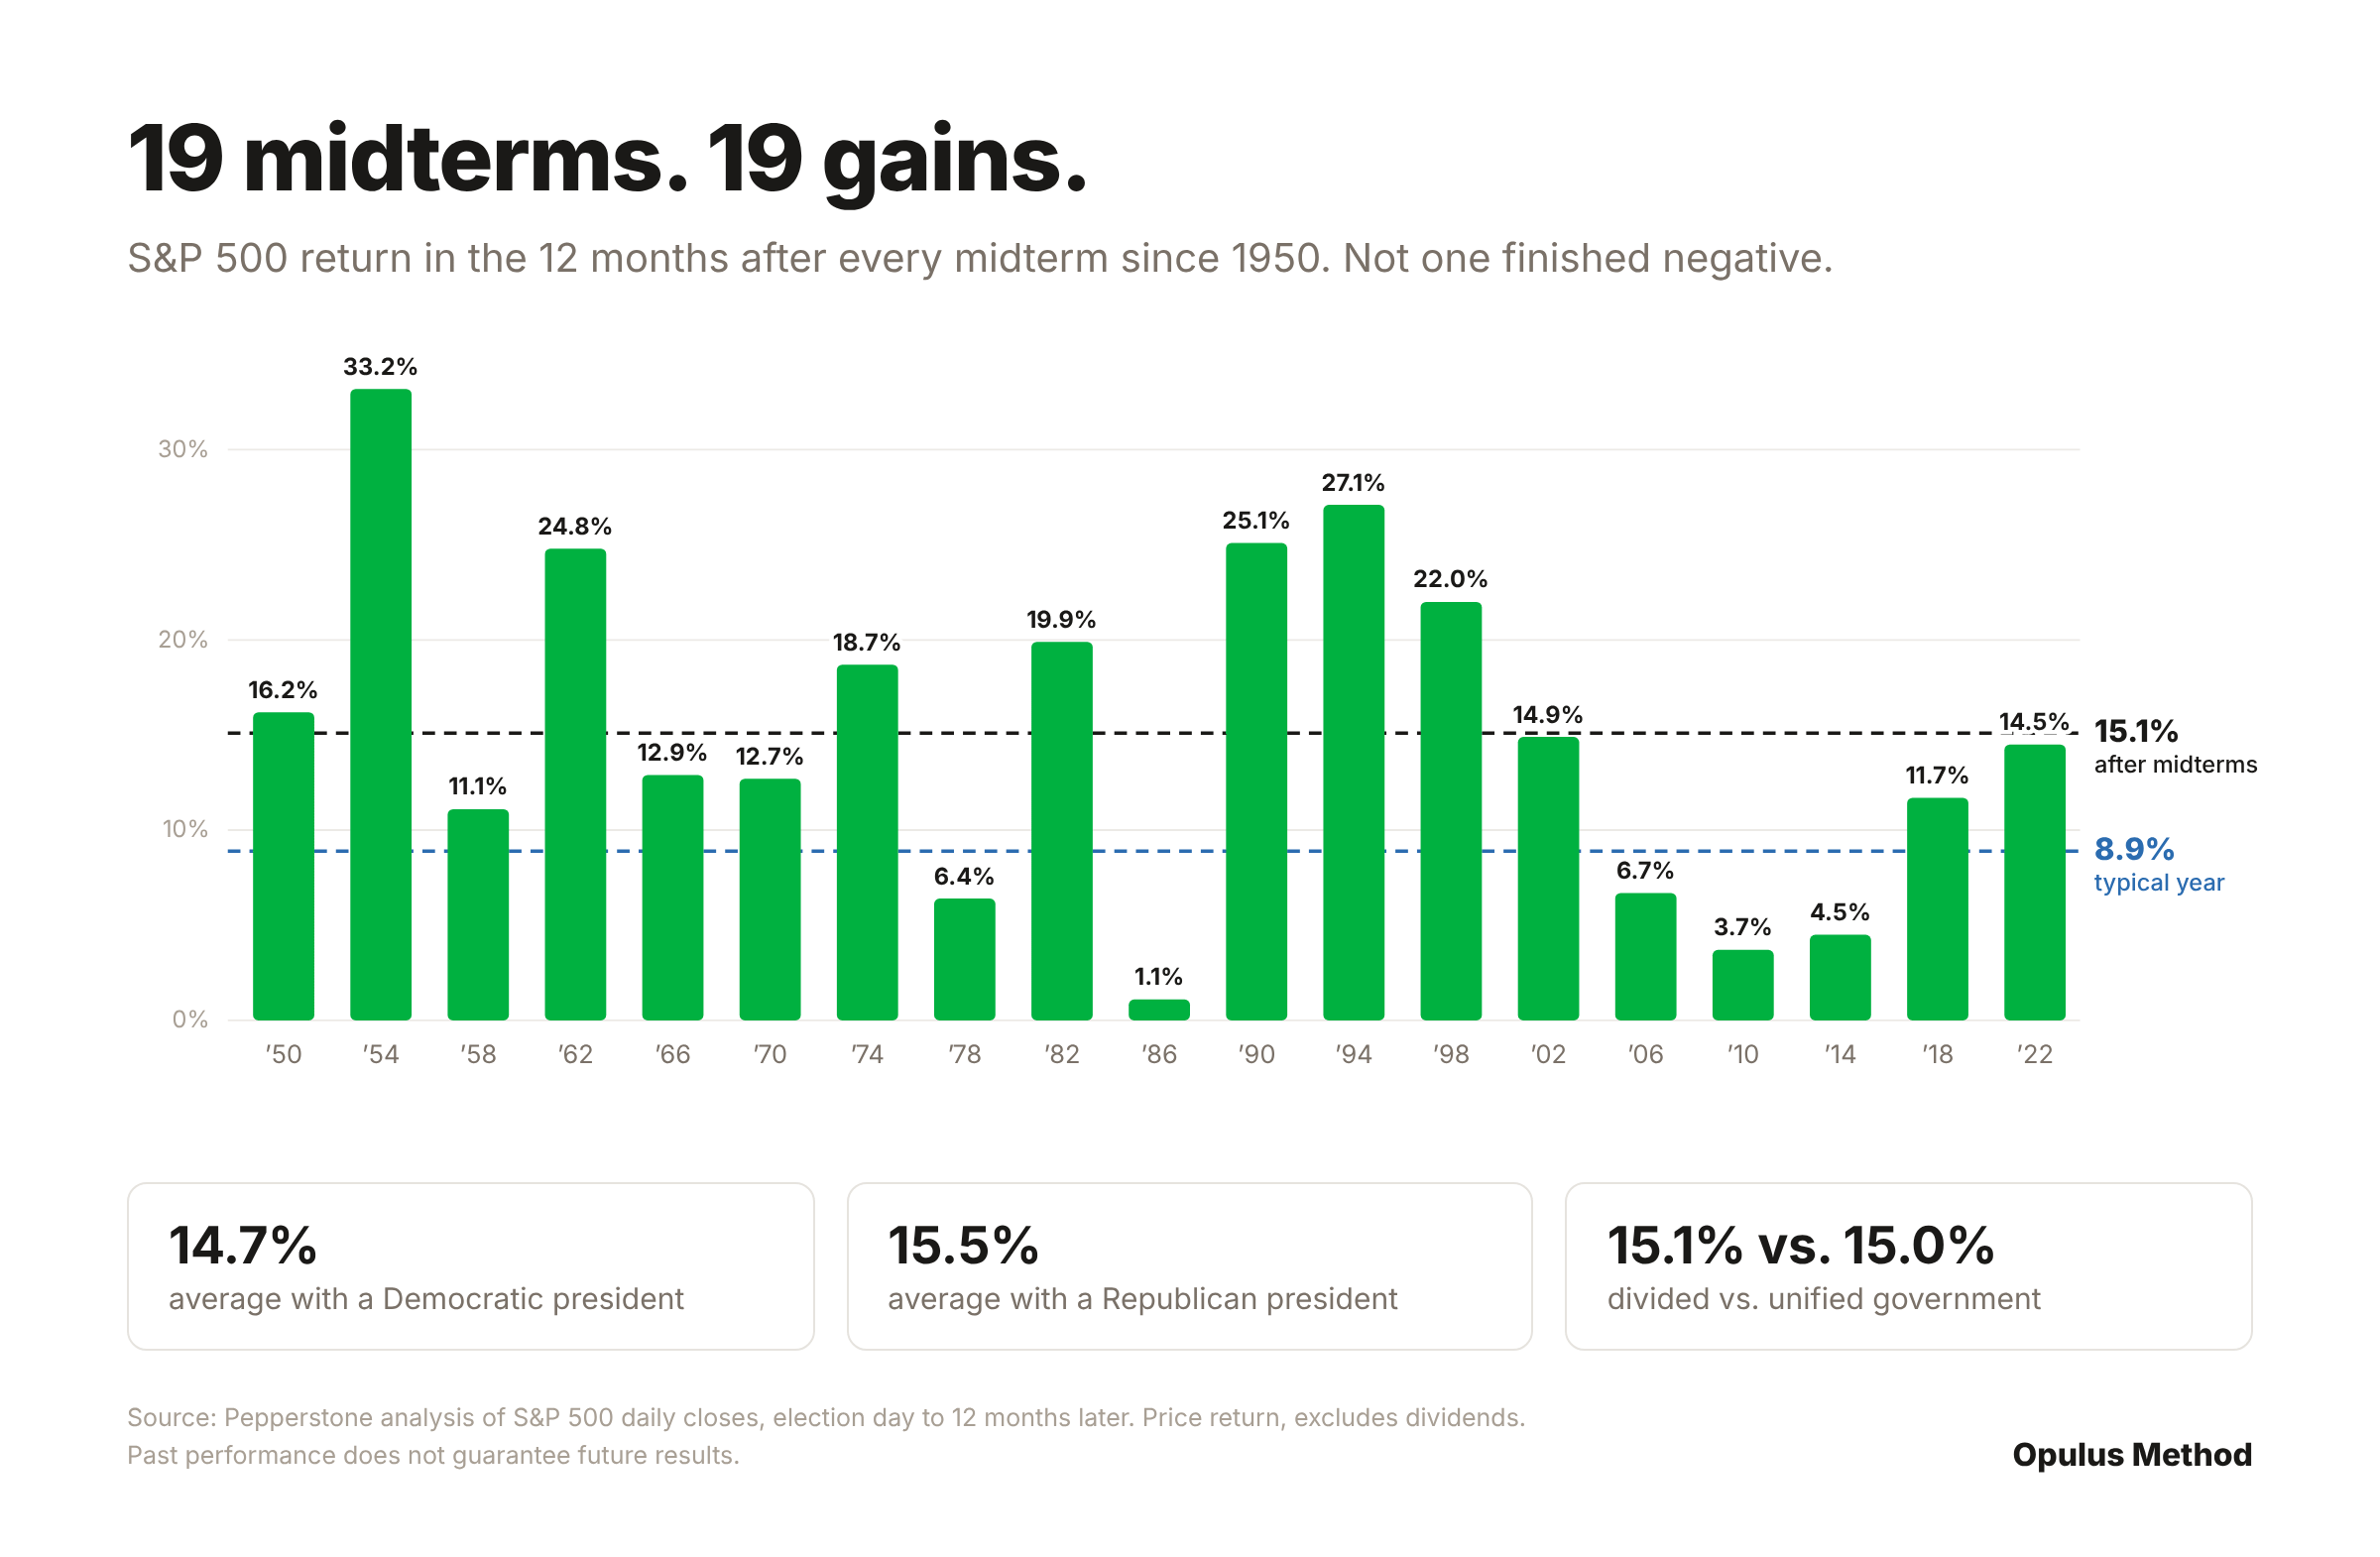
Two caveats, because I’m not here to sell you a magic pattern. Nineteen is a small sample. And every one of those years had its own interest rates, earnings, and recessions doing the real work. Past performance guarantees nothing.
The takeaway isn’t “stocks will be up next November.” The takeaway is that elections have never been a reliable reason to get out.
“My Party Lost” Is an Expensive Investment Strategy
Every election cycle, I hear some version of: “If the other side wins, I’m going to cash.”
Let’s run that math.
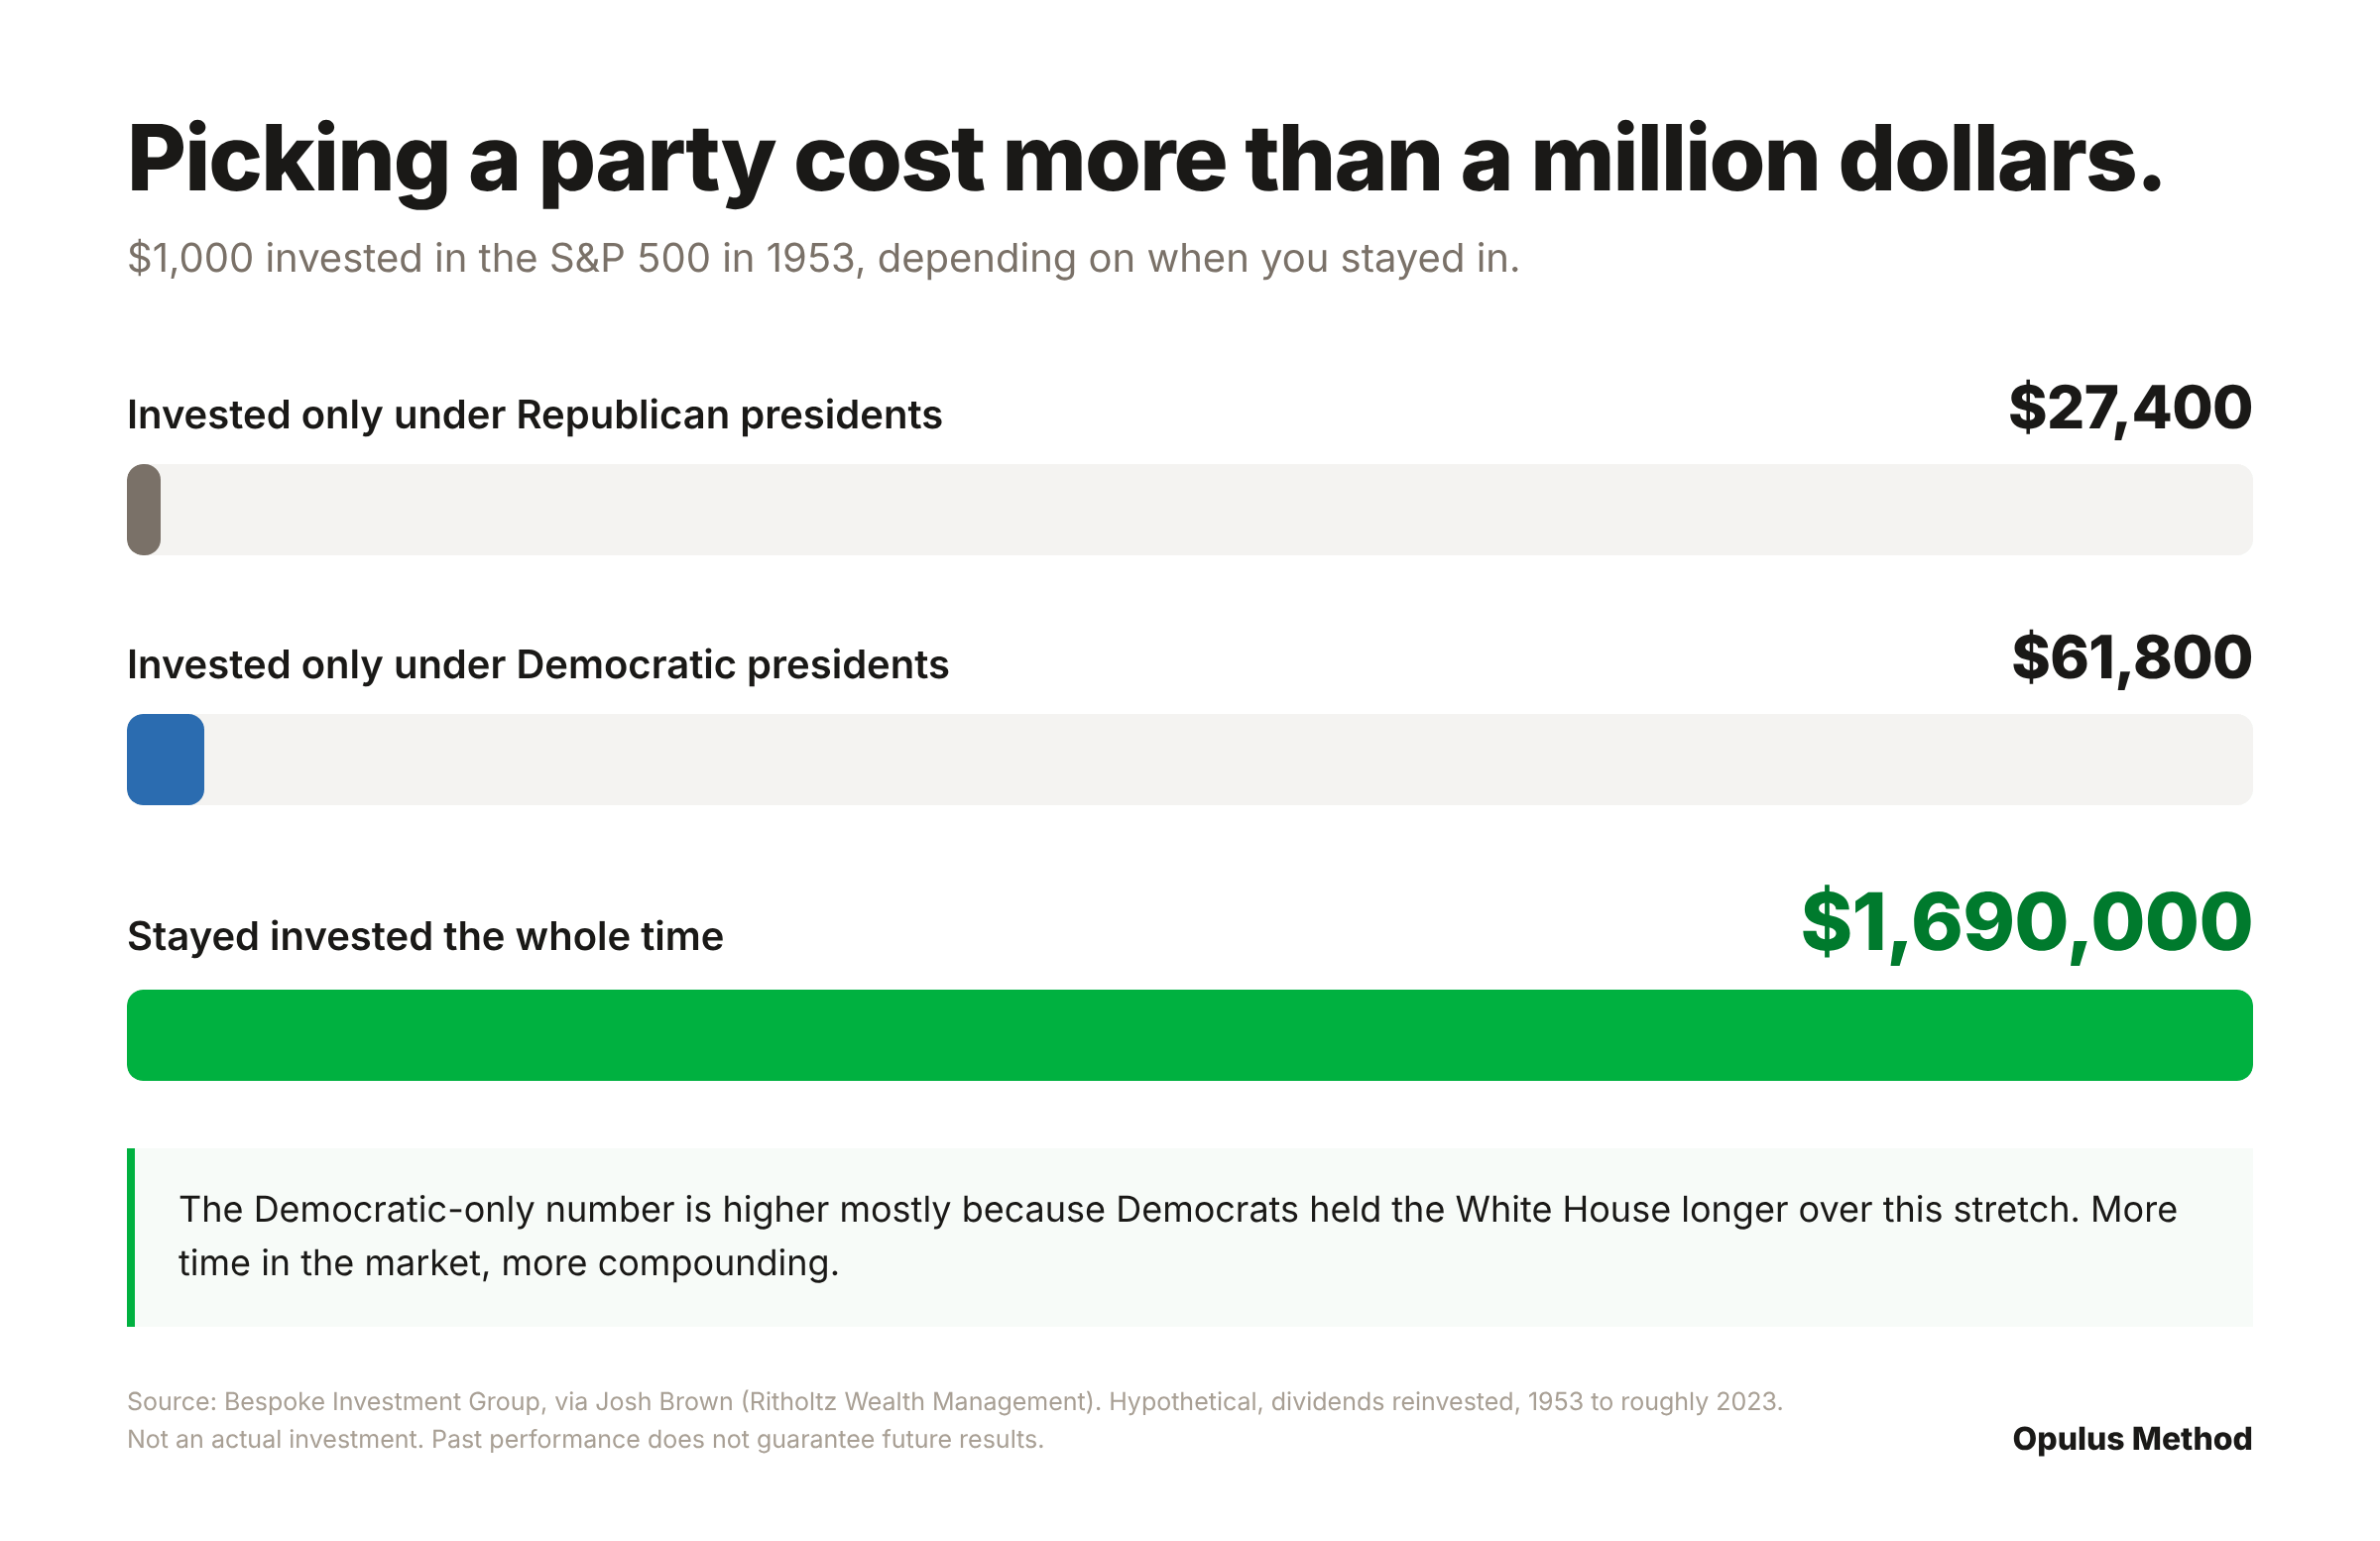
$1,000 invested in 1953 and held only during Republican presidencies: about $27,400.
The same $1,000 held only during Democratic presidencies: about $61,800.
The same $1,000 left invested the whole time, no matter who was in office: about $1.69 million.
Not a typo.
(The Democratic number is higher mostly because Democrats held the White House longer during that stretch. More time in the market, more compounding. That’s the whole point.)
Your vote is a values decision. Your portfolio is a math decision. Mixing the two is how smart people make expensive mistakes.
The Best Days Hide Next to the Worst Days
Last week was a live demo of one of the most important charts in investing.
J.P. Morgan tracks what happens to investors who miss the market’s best days. Over the past 20 years, missing just the 10 best days cut annualized returns roughly in half. And the kicker: 7 of the 10 best days happened within about two weeks of the 10 worst days.
Now look at last week. Best post-midterm Dow day in 44 years. Then the S&P’s worst day since April 2025. Back to back.
If you sold Thursday, you locked in the drop. Now you have to guess when to get back in. You’ve gone from needing zero correct predictions to needing two.
The Levers We Pull When the Rules Change
This is the part I really want to harp on.
New Congress, new priorities. Tax law could change. Estate rules could shift. Something nobody’s talking about yet could land on the table.
Worth knowing: with a Democratic Congress and a Republican president, any major tax bill needs both sides to agree. That’s a high bar. And when laws do change, they usually come with lead time - which is planning time.
If rules change, we don’t panic. We adjust. A financial plan isn’t a static document. It’s a set of levers.
If tax brackets move, we revisit your Roth vs. pre-tax mix.
If capital gains rules change, we rethink the timing of sales and gifts.
If estate exemptions shift, we revisit trusts and gifting strategy.
And right now, volatility itself creates opportunities many financial planners look for:
Tax-loss harvesting. Positions that are down in taxable accounts can be sold to realize losses that offset gains. Mind the wash-sale rule - no buying back the same or a substantially identical investment within 30 days.
Roth conversions. Converting when prices are down means moving more shares for the same tax bill. With roughly seven weeks left in 2026, timing matters.
Rebalancing. If tech ran hot all year, a pullback is a natural moment to get back to your target mix.
Keep contributing. Your 401(k) contributions bought at a discount last week.
All of these are worth discussing with a CPA or financial planner before you act.
What you control: your savings rate, your spending, your allocation, your tax strategy, your behavior.
What you don’t: election results, the Fed, headlines, or Nvidia’s Thursday.
Spend your energy on the first list.
The Bottom Line
Elections create short-term noise, not long-term direction.
The S&P 500 has been higher 12 months after all 19 midterms since 1950, averaging roughly 15%.
Staying invested through both parties beat partisan investing by more than a million dollars per $1,000 invested.
The best days cluster right next to the worst days. Selling on fear usually means missing the rebound.
If laws change, plans change. That’s the job.
You can care deeply about how the election turned out. Just keep it out of your brokerage account.
Control what you can control. Adjust when the rules change. Ignore the rest.
— Fran


Whenever you’re ready, there are 2 other ways we can help you:
Join The Opulus Method Newsletter — Every Tuesday, I share strategies that help high-income millennials build wealth without sacrificing their life. Join 3,200+ readers.
Work With Us 1-on-1 — We’ll build your personalized strategy to cut your taxes, maximize your income, and grow your wealth month after month. You focus on living your life. We handle the financial strategy and execution.
Opulus, LLC (“Opulus”) is a registered investment advisor in Pennsylvania and other jurisdictions where exempted. Registration as an investment advisor does not imply any specific level of skill or training.
The content of this newsletter is for informational purposes only and does not constitute financial, tax, legal, or accounting advice. It is not an offer or solicitation to buy or sell any securities or investments, nor does it endorse any specific company, security, or investment strategy. Readers should not rely on this content as the sole basis for any investment or financial decisions.
Past performance is not indicative of future results. Investing involves risks, including the potential loss of principal. There is no guarantee that any investment strategies discussed will result in profits or avoid losses.
All information is provided “as-is” without any warranties, express or implied. Opulus does not warrant the accuracy, completeness, or reliability of the information presented. Opinions expressed are those of the authors, Ryan Greiser and Francis Walsh, and are subject to change without notice.
Opulus is not responsible for any errors or omissions, nor for any direct, indirect, or consequential damages resulting from the use or reliance on this information. Use of the content is at your own risk. This content is not intended as an offer or solicitation in any jurisdiction where such an offer or solicitation would be illegal.