

Everyone Thinks They Can Handle a Crash. Most Can't.

A friend called me in March 2020 - three weeks into the COVID crash - and said something I hear in some version almost every year: “I thought I was fine with risk. I’m not fine.”
He wasn’t panicking because the market was down. He was panicking because he’d finally done the math. Not the percentage. The dollars. His $340,000 account had become $225,000 in about three weeks. That’s $115,000 - gone from his screen, every time he opened the app.
He hadn’t changed. His questionnaire answers hadn’t changed. But his behavior was about to.
This is the gap that destroys wealth - not bad investment picks, not wrong asset allocation, not timing the market. It’s the distance between the risk tolerance you think you have and the one you actually have. And most people don’t find out where they really stand until it’s too late to adjust without damage.
Today we’re going to close that gap. Let’s dig in.
Why Risk Questionnaires Fail You
Every brokerage, 401(k) platform, and financial planning tool asks some version of the same question: “If your portfolio dropped 20%, what would you do?”
A) Sell B) Hold C) Buy more
In a bull market - when your account is up and losses feel abstract - almost everyone answers C. Of course you’d buy more. Stocks are on sale. You’ve read the books. You know the math.
Then an actual crash happens.
There’s a concept in behavioral economics called stated vs. revealed preference. Stated preference is what you say you’d do. Revealed preference is what you actually do when the situation is real and the stakes are yours. In investing, these two things are frequently very different - and the gap between them is exactly what costs people money.
The questionnaire captures your stated preference. Your behavior in February 2020 or late 2022 captures your revealed preference. One of those is your actual risk tolerance. The other is just an answer to a hypothetical.
Tolerance vs. Capacity: Two Different Things
Most people use “risk tolerance” to mean one thing. It’s actually two.
Risk tolerance is the volatility you can stomach emotionally - the psychological experience of watching your portfolio fall and not doing something destructive. Risk capacity is the volatility your financial situation can actually absorb without derailing your life.
You can have high tolerance and low capacity. You might be completely unbothered watching your account drop 40% - but if you’re 61, that drop could mean pushing back retirement by a decade. Your emotions are fine. Your plan isn’t.
You can have low capacity and high tolerance. A 35-year-old with a stable income and 30 years until retirement has enormous capacity to absorb losses - time does the healing. But if that same person panics and sells every time there’s a correction, the capacity doesn’t matter. The behavior negates the advantage.
A plan that only accounts for one and ignores the other isn’t a plan. It’s a guess.
The Dollar Math Nobody Runs
Percentages are comfortable. Dollars are real. And until you convert one to the other, you haven’t actually confronted your risk.
Here’s what three major crashes look like on a $500,000 portfolio:
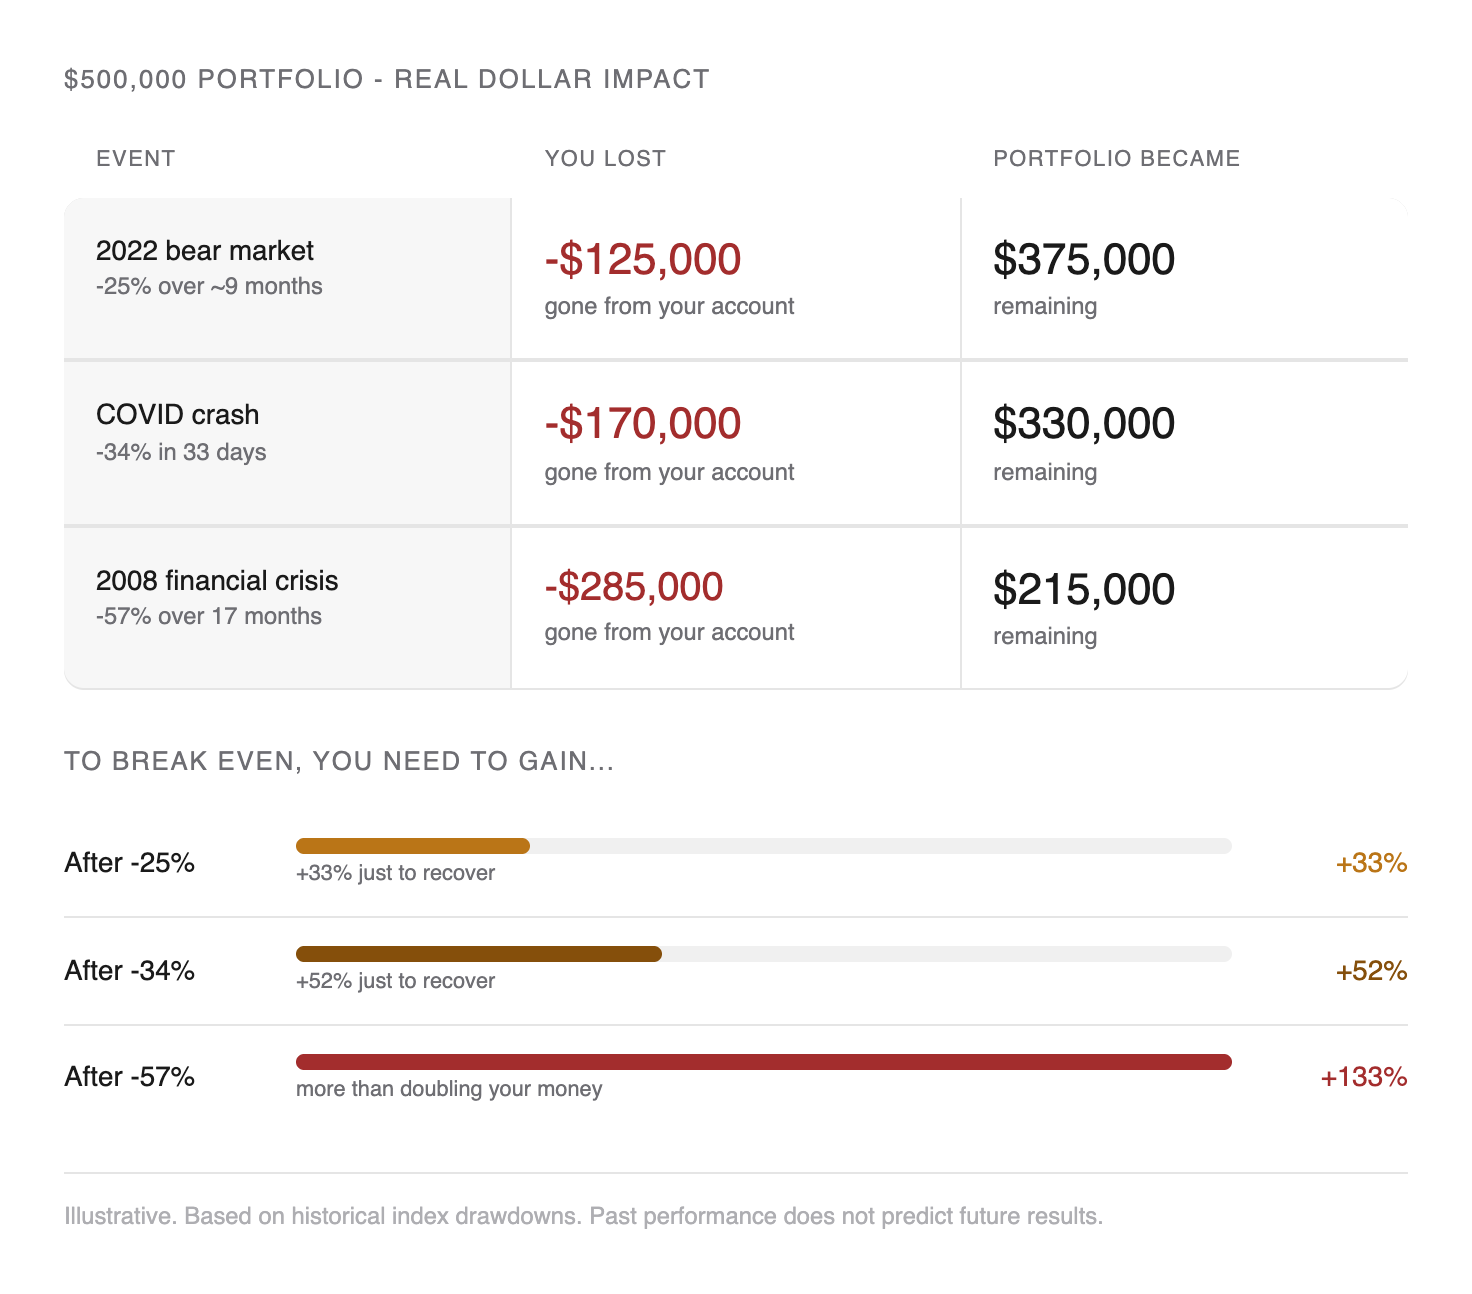
2022 bear market (-25%): $500,000 becomes $375,000. You lost $125,000.
COVID crash (-34%): $500,000 becomes $330,000. You lost $170,000.
2008 Financial Crisis (-57%): $500,000 becomes $215,000. You lost $285,000.
These aren’t abstract percentages. That’s real money, gone from your account, possibly for months or years.
And here’s the part that almost nobody realizes: the recovery math isn’t symmetric. If you lose 25%, you don’t need to gain 25% back to break even. You need to gain 33%. Lose 34%, you need 52%. Lose 57%, you need to more than double your money - a 133% gain - just to get back to where you started.
A 57% loss is not recovered by a 57% gain. This is the math that rewrites retirement timelines.
The Same Crash, Two Completely Different Consequences
Here’s where tolerance and capacity collide in the real world.
Person A is 35 years old with a $500,000 portfolio. After a 57% crash, she has $215,000. She has 30 years until retirement. Her income is intact. Her expenses are covered. She keeps buying. In 30 years at historical returns, that $215,000 has time to become something significant - and the contributions she makes at depressed prices accelerate the recovery.
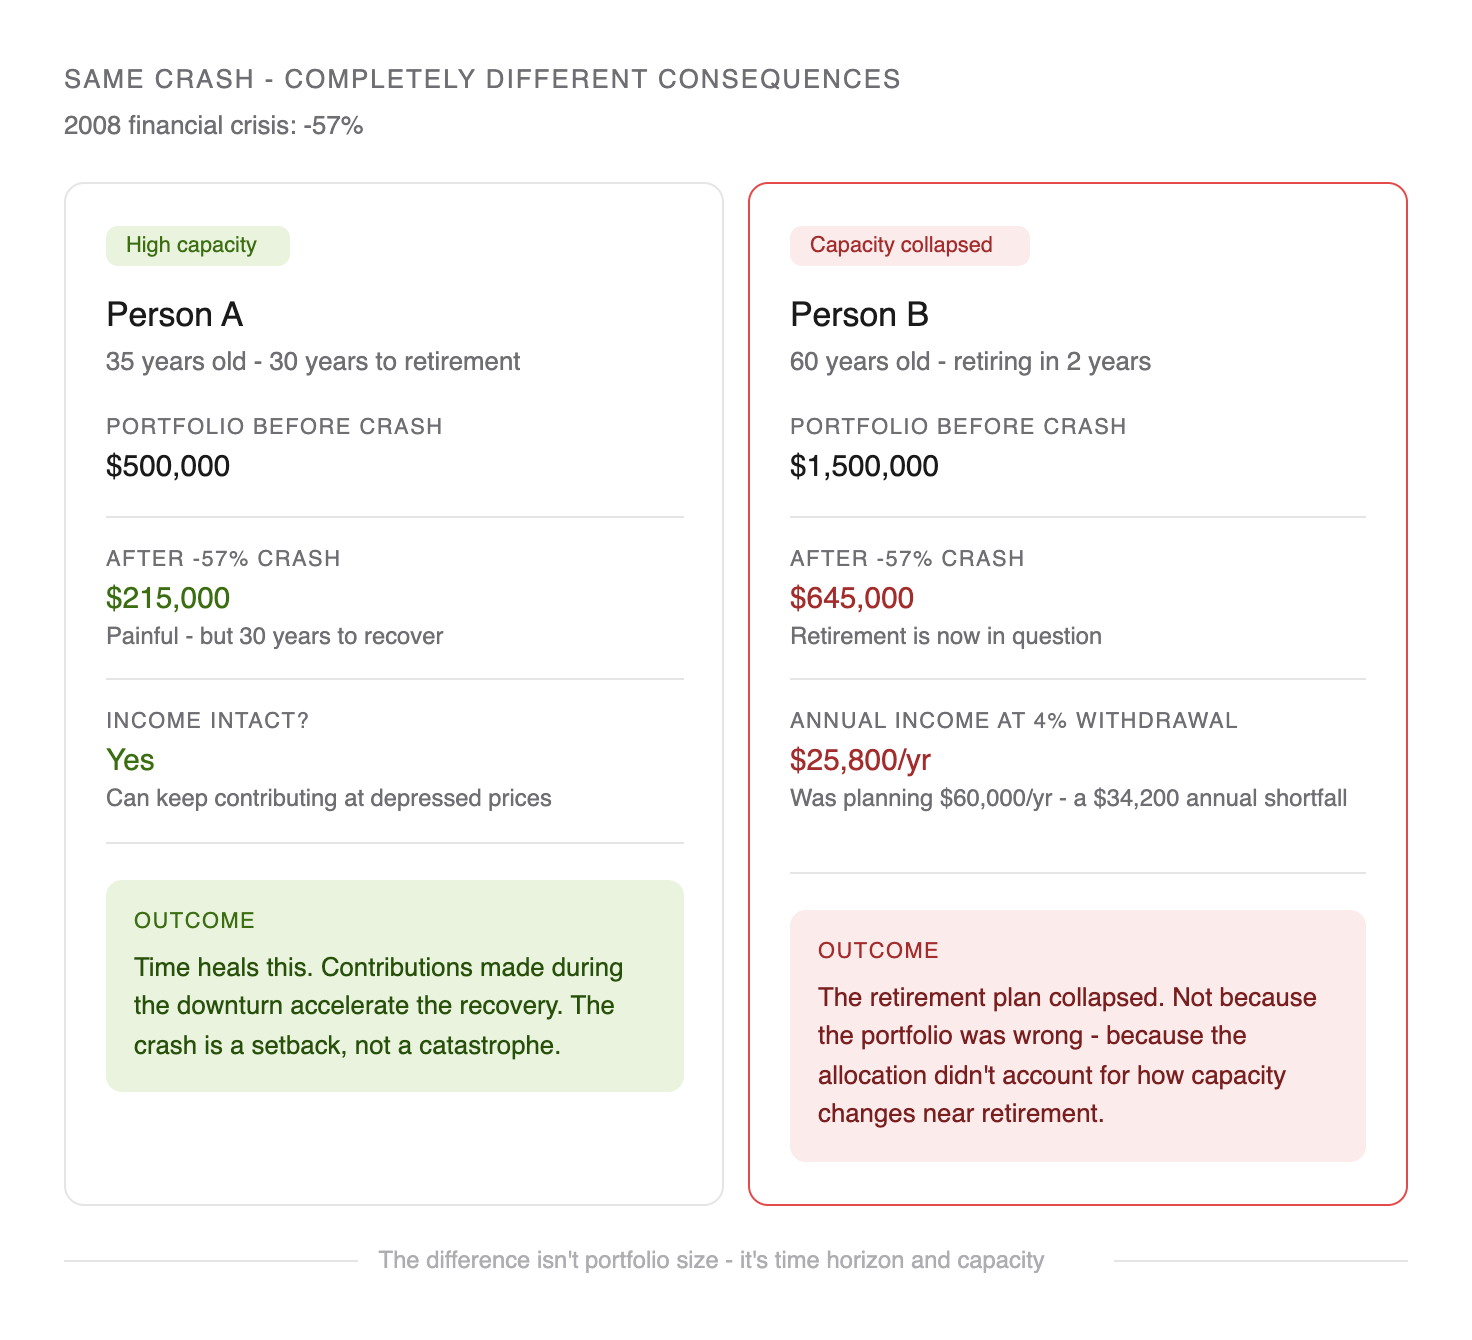
Person B is 60 years old with $1,500,000. He was planning to retire in two years. After the same 57% crash, he has $645,000. His retirement math just broke. He was counting on the standard 4% withdrawal rule to generate $60,000 per year. On $645,000, that’s $25,800. That’s a $34,200 annual shortfall - every year, for the rest of his retirement.
Same crash. Same percentage loss. Completely different consequences. The 35-year-old had high capacity. The 60-year-old had what felt like high capacity - until it mattered.
This is why allocation should shift as you approach retirement. Not because stocks become bad investments, but because your capacity to absorb a loss without consequence shrinks every year. The sequence of returns you experience in your final few working years can be more impactful than everything that came before.
The Generation That Hasn’t Been Tested
If you started investing after 2009, here’s an honest accounting of what you’ve actually experienced:
You’ve lived through one of the longest bull markets in history. You lived through COVID, which was a 34% crash - brutal and terrifying - but also the fastest recovery on record. And you lived through 2022, which was a painful ~25% drawdown that lasted about nine months.
What you haven’t experienced is a prolonged, multi-year downturn with no fast recovery in sight. The kind where 12 months in, things are still down 40% and there’s no clear catalyst for improvement. The kind that tests whether your behavior holds over years, not weeks.
This isn’t a criticism - I’m in this camp too. It’s a planning input. If your entire investing experience has occurred during an era of relatively fast recoveries, your revealed preference hasn’t been fully tested yet. Build your plan knowing that.
What Your Real Tolerance Actually Looks Like
Here’s a more honest way to find out where you stand than any questionnaire.
Look back at 2022. What did you actually do? Did you keep buying systematically, essentially unbothered? Did you check your account less often and let the autopilot run? If so - high tolerance. Your plan can reflect that.
Did you open your account more than usual, stress about it, consider selling, or actually sell some positions? That’s your real number. Not what you told the questionnaire. What you did.
The real stress test isn’t “could you hold through a 30% drop?” It’s: could you keep buying? Could you add money to positions that are down 35% when the news cycle is telling you the world is ending? Because that’s what the math rewards - and it’s what almost nobody actually does.
The cost of panic selling isn’t hypothetical. In 2022, a $500,000 portfolio hit a low of around $375,000. Someone who held and benefited from the 2023 recovery of roughly 24% recovered to about $465,000. Someone who sold at the bottom and stayed in cash sat at $375,000. The cost of that panic: roughly $90,000. Not a future projection. A documented outcome that happened to real people in real accounts.
How to Calibrate Your Plan to Your Actual Risk Profile
The goal isn’t to eliminate risk - it’s to hold risk you can actually sustain through a real downturn. Here’s how to get there:
Start by running the actual dollar math on your current portfolio. Not percentages - dollars. If your portfolio fell 25%, what would that number be? 40%? 57%? Write it down and sit with it for a minute. If that number makes you feel sick, your current allocation may not match your actual tolerance.
Then assess your capacity honestly. How many years until you need this money? Do you have 6-12 months of cash set aside so that a market drop would never force you to sell? Is your income stable enough to keep contributing through a downturn?
If recent volatility made you uncomfortable or you found yourself checking your accounts more than usual, three adjustments are worth discussing with a financial planner: a larger cash buffer so you’re never in a position where you have to sell at a loss, reducing speculative or high-volatility positions, and shifting toward a less aggressive allocation overall. Not because markets are bad - because a plan you abandon during a crash is worse than a conservative plan you hold forever.
The most expensive allocation isn’t the one that takes the least risk. It’s the one that takes more risk than you can actually sustain behaviorally.
Bottom Line: Build for the Portfolio You’ll Actually Keep
Stated vs. revealed: what you say you’d do and what you actually do in a real crash are frequently different - and only one of them matters.
Tolerance and capacity are not the same thing. Your plan needs to account for both.
The recovery math is asymmetric: a 57% loss requires a 133% gain to break even.
Your capacity changes over time - high at 35, potentially much lower at 60.
The best portfolio isn’t the one optimized for maximum returns. It’s the one you’ll hold through a prolonged downturn without doing something that locks in permanent losses.
Risk tolerance isn’t a questionnaire score. It’s what you do when your account is down and staying down. Design your plan around that person.
See you next week.
— Fran


Whenever you’re ready, there are 2 other ways we can help you:
Join The Opulus Method Newsletter — Every Tuesday, I share strategies that help high-income millennials build wealth without sacrificing their life. Join 3,200+ readers.
Work With Us 1-on-1 — We’ll build your personalized strategy to cut your taxes, maximize your income, and grow your wealth month after month. You focus on living your life. We handle the financial strategy and execution.
Opulus, LLC (“Opulus”) is a registered investment advisor in Pennsylvania and other jurisdictions where exempted. Registration as an investment advisor does not imply any specific level of skill or training.
The content of this newsletter is for informational purposes only and does not constitute financial, tax, legal, or accounting advice. It is not an offer or solicitation to buy or sell any securities or investments, nor does it endorse any specific company, security, or investment strategy. Readers should not rely on this content as the sole basis for any investment or financial decisions.
Past performance is not indicative of future results. Investing involves risks, including the potential loss of principal. There is no guarantee that any investment strategies discussed will result in profits or avoid losses.
All information is provided “as-is” without any warranties, express or implied. Opulus does not warrant the accuracy, completeness, or reliability of the information presented. Opinions expressed are those of the authors, Ryan Greiser and Francis Walsh, and are subject to change without notice.
Opulus is not responsible for any errors or omissions, nor for any direct, indirect, or consequential damages resulting from the use or reliance on this information. Use of the content is at your own risk. This content is not intended as an offer or solicitation in any jurisdiction where such an offer or solicitation would be illegal.